Numbers are powerful, but sometimes, seeing them visualized can make all the difference. In Part 5 of our “Budget and Expense Tracking” series, we’ll guide you to analyze your budget and data visualization in MS Access. We’ll show you how to leverage the built-in charting and reporting functionalities to transform your raw financial data into clear, insightful visuals.
These charts and reports will not only make your data easier to understand but also help you identify trends, track progress toward your financial goals, and make data-driven decisions to optimize your budget and achieve financial wellness.
Overview
As you know, the budget allocation period is based on one month and should have to be closed before the new budget allocation for the next month.
- We will build 2 types of charts in the Main Dashboard form:
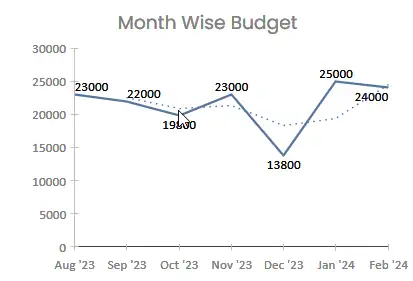
- The month-wise trend of the budget allocation in a chart view
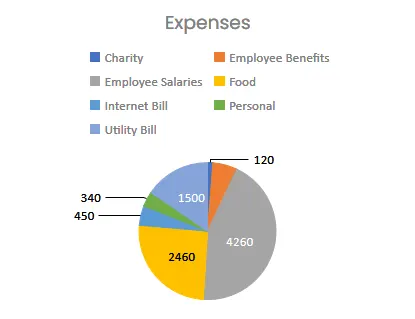
- Each expense’s total amount spent in a pie chart view
- We will create a complete month-wise expense summary for each expense category.
- An expense-wise budget report.
- The Mian Dashboard subform contains each expense account spending, we will build an Expense Analysis form which will include trends.
Budget and Expense Charts
Monthly Budget Trend
Click on “Insert Modern Chart” from the menu and select the desired chart from the list.
The Data Source of the chart will be the Budget Table.
The X-axis will be the Budget Amount field and the Y-axis will be the Month Duration field.
Expenses Spending
The Data Source of the chart will be the second query that we created in Part 2 of this project.
The X-axis will be updated with the Expense Name and the Y-axis will be the Sum of the Amount of Expense.
The Data Labels will be enabled from the format section.
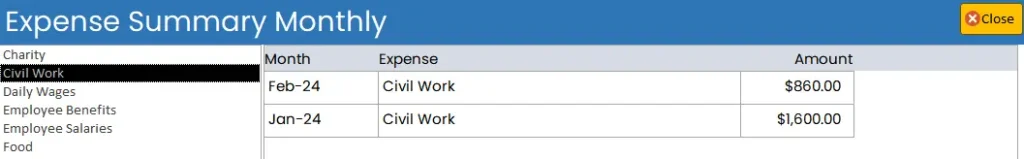
Expense Summary
To get the sum of the total amount against each expense, we will create a query by using the Sum function in the “Totals” row.
In the Expense Summary, the Subform will be filtered by selecting the expense account from the List box.
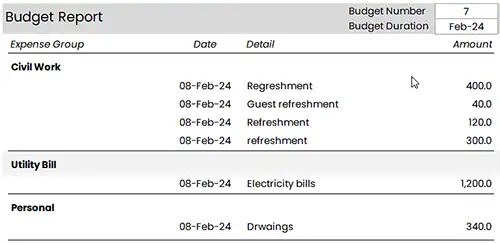
Budget Report
The budget report will be based on a query adding all 3 tables.
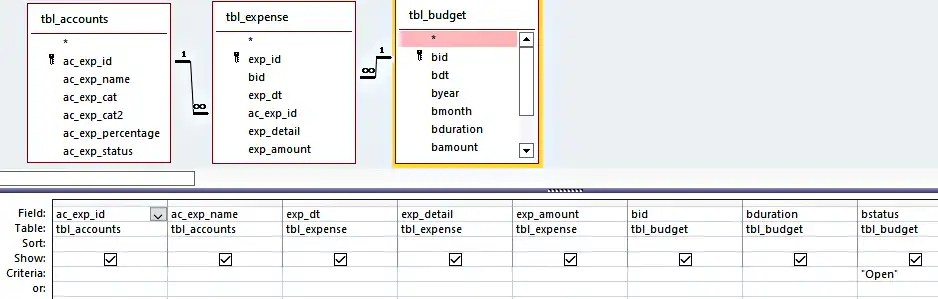
From the Report Wizard, we will select the grouping level Expense Name. The report will look like this:
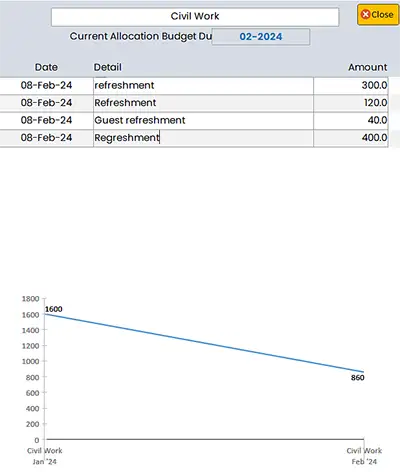
Expense Transactions and Analysis
The Main Dashboard subform is grouped with the summary of expense accounts with the sum of spending. The “Analysis” button will open a form (Expense Detials) with all tractions against a particular expense account.
The “Analysis” button code to open the Expense Detail form based on the criteria of expense name:
Private Sub Command16_Click()
    DoCmd.OpenForm "ExpenseDetail", , , "ac_exp_name= '" & Me.ac_exp_name & "'", , acDialog
End Sub
The second part of the Expense Details is to analyze the spending with the previous trend. Here is an example of final view of the form: