Ready to visualize your financial health? Let’s leverage the power of MS Access to create dynamic dashboards that bring your financial data to life. In this part of our “Budget and Expense Tracking” series, we’ll guide you through the process of building a powerful dashboard for budget and expense that provides a clear and insightful overview of your spending habits. These dashboards will not only help you stay motivated throughout your budgeting journey but also allow you to identify areas for improvement and make informed financial decisions.
Overview
We will establish a spending summary as a header section of the Dashboard. There will be 4 amount figures which will update as changes in the backend data.
- Current month assigned budget quota
- Remaining balance in running budget with amount and percentage
- Total Expenses amount
- Today’s Expenses
A subform will reflect each expense account’s total spending from the allocated expense quota.
The summary of each expense transaction can be viewed from the “Details” button.
Each expense spending can be viewed as per the previous trend through the “Analysis” button.
Creating Query
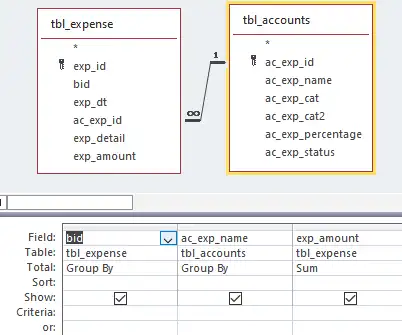
First of all, we need to create a query based on both tables of Expense and Accounts to show the accumulative amount and percentage of each expense quota consumption.
This process will give you the sum of each expense account.
To get the Budget ID of each expense account, we need to create another query based on the first query and budget table.

The percentage will be formulated through the Expression Builder with this statement:
exp_percentage: [SumOfexp_amount]/[bamount]Creating Dashboard Form
The form’s record source should be based on the Budget Table because we will be using a SubForm.
Header Section
Header section that will contain the updated budget and expense-related figures:
Budget Amount: The text box will be updated based on the Budget Amount field.
Remaining Balance: The text box will be updated based on the Budget Balance fields.
Total Expense: The text box will be updated with the Expression Builder.
=nz([bamount] - [bbalance]),0Expense Today: The text box will be updated according to the daily transactions of expenses.

Subform
Create a SubForm based on the Second Query that we have already created. The final Dashboard with the SubForm will look like this:


